Spring 2024: Heath Foster
Beyond the Finish Line: An Analysis of Formula 1 Qualifying and Points Systems on Worldwide Audience Engagement
Heath Foster
Media Analytics, Elon University
Submitted in partial fulfillment of the requirements in an undergraduate senior capstone course in communications
Abstract
Formula 1 dominates the hierarchy of professional racing as the pinnacle of speed, driver talent, and engineering. The multi-billion-dollar industry, with hundreds of millions of unique viewers, is partially dependent on the public’s perception of competitiveness during the racing season. This study analyzes 82 Formula 1 Grands Prix from 2019 through 2022 to determine how outcome uncertainty, as defined by race-specific qualifying times and final driver and constructor point totals, impact global Formula 1 viewership. Through an analysis of constructor’s point data, correlations emerge indicating that as the point differentials between teams increase, viewership counterintuitively rises. Fans also do not typically exhibit a significant preference for more competitive qualifying sessions or overall seasons. Additionally, findings suggest that in the short to medium term, a decline in outcome uncertainty—assessed by the mentioned variables—has minimal impact on viewership. This study provides valuable implications for Formula 1 stakeholders aiming to optimize global audience engagement and sustain interest in the sport over time.
Keywords: Formula 1, sports viewership, audience engagement, sports entertainment
Email: hfoster8@elon.edu
1. Introduction
Born at the iconic Silverstone Circuit in the United Kingdom in 1950, Formula 1 is nestled at the pinnacle of motorsport’s hierarchy, standing as the unparalleled spectacle of speed, technology, and sheer grandeur (Evans, 2013). Pairing cutting-edge engineering with ultimate human prowess to create a symphony of power and precision, it has captivated billions of fans from across the globe for decades (Schneiders & Rocha, 2022).
Formula 1 races with single-seat, open-wheel cars on both permanent and street circuits. Currently, 10 teams with two drivers each compete in the 23-race season across 20 countries (Coleman, 2023). They race for both the World Drivers’ Championship (WDC), an individual award, and the World Constructors’ Championship (WCC), a combined team award (Bianchi, 2023).
European manufacturers and drivers, most notably the Italians, dominated the sport’s early presence (Capparelli, 2016). The sport did eventually grow into Asian markets throughout the 1980s, with Japan, China, Singapore, South Korea, India, and Azerbaijan hosting events, and further extended into the Middle East throughout the early 2000s, with races hosted in Bahrain, Abu Dhabi, and Qatar (Wood and Burkhalter, 2023). Further, the United States now hosts races in Austin, Miami, and Las Vegas, the latter of which have only been added in 2022 and 2023 seasons.
Since 2010, only four drivers (Sebastian Vettel 2010-2013, Lewis Hamilton 2014-2015, 2017-2020, Nico Rosberg 2016, and Max Verstappen 2021-2023) have won the WDC, with only two constructors (Mercedes 2014-2020 and Red Bull 2010-2013, 2022-2023) winning the WCC during that same period (Butler et al., 2023). While constructor championships have historically shown years of single-team dominance, the reduction in the number of successful drivers over the past decade is largely unprecedented in Formula 1 (Bianchi, 2023).
As drivers and teams battle on the tarmac of Formula 1 circuits and wage strategic warfare on the pit wall, their performance is scrutinized by fans, experts, and stakeholders (Schreyer & Torgler, 2018). As with any sport, success is the currency that drives both adoration and critique (Wood & Burkhalter, 2023). Fans, whether lifelong enthusiasts or recent converts, hang on to the edge of their seats as they witness the mastery of drivers navigating hairpin turns and the precision of split-second pit stops. From the historical significance of legendary circuits to the impact of new technical regulations, unpredictable variables blend and constantly reshape the popularity of Formula 1 (Garcia & Reade, 2021).
This research paper aims to examine the connections between qualification times, driver points, and constructor points in Formula 1, seeking to determine whether and to what extent the differences in these performance metrics influence the global season average viewership of the sport. With data collected from the 2019-2022 Formula 1 seasons, the study will analyze the correlation of the three listed independent variables to global viewership. The study seeks to shed light on the interplay of variables that underpin viewers’ engagement with Formula 1 and contribute to a more comprehensive understanding of the driving forces behind the sport’s immense, yet volatile, global popularity.
II. Literature Review
The literature review provides information on two crucial concepts. The first section explores the traditional understanding of outcome uncertainty as it relates to Formula 1 with the various methods researchers have used to analyzed it. The second section provides a discussion on how those measures of uncertainty affected the various audiences in which they were studied.
Traditional Understanding of Outcome Uncertainty
In traditional team sports, two dominant approaches have been pursued to capture both the quality of competition and the uncertainty regarding the event outcome (Rottenberg, 1956; Neale, 1964). In Formula 1, the latter has typically been represented by measures that rely on information provided by season-long point totals, betting odds, and qualification times (Butler et al., 2023).
Primarily, researchers have analyzed season-long point totals to measure uncertainty. Examining the relationship between TV demand and race outcome uncertainty in Formula 1, Kipker (2003), first related outcome uncertainty with the point difference between those drivers ranked first and last in the Formula 1 WDC. Similarly, Krauskopf et al. (2010) proxied race outcome uncertainty via a concentration index based on points from the championship. While these metrics offer a decent summary of events over the span of a season, they are an overhead view. These numbers can only help explain season-long competitive balance as they are a running total through the final weekend of the season (Butler et al., 2023). However, it must be considered that championship rankings rely on data that is several weeks old and does not consider a racer’s form on the day of the race or his comparative strength of handling on the actual racetrack (Garcia & Reade, 2021).
Betting odds to quantify contest balance are commonly used to capture contest outcome uncertainty (Butler et al., 2023). These measures have greatly increased understanding of social preferences for uncertainty in Formula 1 (Schreyer & Torgler, 2018). As per the traditional outcome uncertainty hypothesis, one could expect a negative relationship between increasing differences in adjusted betting odds and viewer demand (Garcia & Reade, 2021). A notable study analyzed the differences in betting odds of Formula 1 drivers placed in positions 1-5 on the starting grid for each Grand Prix (Butler et al., 2023). The average odds for the driver in pole position in the study show a clear favorite for each race. Consequently, lower average odds for the car starting first on the grid suggest a less competitive championship for both drivers and constructors (Garcia & Reade, 2021). This understanding implies decreased viewership because of lower outcome uncertainty from the original betting lines.
Qualifying times as a determinant for outcome uncertainty have been researched as well. As the qualifying is staged in the days just before a race, it provides an unobstructed view of the expected driver performance at a certain track at the last possible moment before the actual race (Screyer & Torgler, 2018). One would assume that as the summed difference in the qualifying time of the three drivers with the highest winning probability decreases, uncertainty regarding the outcome of the race increases (Gooding & Stephenson, 2017). However, contrary to expectations, fans in the United States did not appear to be overly concerned about a lack of uncertainty of outcome upon initial research (Butler et al., 2023). Perhaps because fans in the U.S. are passionate about Formula 1, uncertainty of outcome in the sport is less of a concern to viewers. Such findings differ from the most recent research on German markets (Baecker et al., 2022) and must be explored further.
Impacts on Viewership Trends
Understanding what constitutes a “viewer” of Formula 1 is a vital piece of this research. In 2004, Formula 1 shifted from a cumulative audience measurement system to a calculation of unique viewers. The shift was predominant response to absurd results posted in previous years, such as a reported 57.8 billion viewers reported for the 1999 season, a figure nearly ten times greater than the world’s total population at the time (Goswami, 2023). After the change, a viewer was counted as a person who watched 15 non-consecutive minutes of Formula 1 at any point during the season and were not counted again regardless of how much content was viewed (Sylt, 2020).
The next substantial shift in viewership measurement came in 2018, a year after Liberty Media purchased Formula 1. The minimum number of minutes which needed to be watched to count as a viewer was lowered from the threshold of 15 non-consecutive minutes to three consecutive minutes at any point within the season to match the industry standard (Sylt, 2020). A 10% increase in unique viewers was reported that year, which makes analysis across the past decade nearly impossible due to the differing criteria.
Presently, the vast majority of Formula 1 viewership research relates to German audiences, which isn’t surprising considering the European heritage of the sport and the open access to German broadcasting data (Baecker et al., 2022; Schreyer and Torgler, 2018). In Formula 1, the fluctuation in TV viewership figures poses a significant risk to the sport, especially financially (Schneiders & Rocha, 2022). This understanding of fluctuations is presented through three additional variables that must be considered with outcome uncertainty.
Primarily, technological advancement may have influenced the recent drop in TV viewership. In the short run, this has made the sport more predictable, with dominant teams and drivers winning nearly every weekend (Wood & Burkhalter, 2023). Such vast competitive difference in the sport has completely thrown off its balance and ultimately lost several previously interested markets (Butler et al., 2023). In the long run, however, technology may create some unpredictability, helping new teams to win races and championships and increasing race outcome uncertainty (Schneiders & Rocha, 2022). While engineering advantage is not the basis of this research, it is a fundamental concept to understand in the broader scope.
Outside of the cars themselves, one must consider the impact of mobile devices, social media, and streaming services. The world has effectively shrunk into our pockets (Van Reeth, 2023). This increased accessibility, growing economic potential, and the rise of international competition hallmark the new era of sport (Capparelli, 2016). Engagement can no longer be determined by simple viewership figures, as audiences with different consumption behaviors receive sporting content from a variety of sources. Streaming, highlights, and post-race recaps have decreased the casual fan’s interest in watching live sports (Budzinski & Müller, 2016). This raises specific concern for Formula 1, where Grands Prix occasionally take place late at night due to the sport’s international schedule. Globalization has connected audiences from across the world, but the same technological advancements have completely fractured the fanbase due to differing consumption preferences (Wood & Burkhalter, 2023).
A large part of the expansion of Formula 1 into the United States market was to capitalize on the “American” spectacle (Wood & Burkhalter, 2023). While champagne celebrations and flyovers are consistent among race weekends, locations such as Las Vegas and Miami are notorious for their entertainment potential, which could ultimately spark interest in racing once again (Schneiders & Rocha, 2022). Similarly, the impact of heritage sites such as Monza, the birthplace of Ferrari; Silverstone, the iconic British circuit; and Monaco, perhaps the most well-known race venue, are of equal importance (Evans, 2013). Consequently, the combination of spectacle and location have tremendous effect on viewership (Caparelli, 2016).
Additionally, to fully understand the scope of the following research, readers must be made aware of several factors related to the sport’s regulations and procedures:
Qualifying
Qualifying is used to establish the starting grid position of each driver for the official race on Sunday. The event traditionally takes place on Saturday – except for on sprint weekends where qualifying is held on Friday afternoon (Rivera, 2023).
The qualifying session is divided into three segments. During the first qualification segment (Q1), all drivers are staggered onto the track with the goal of setting the fastest lap time possible within an 18-minute window. After this segment, the five slowest drivers are eliminated from further contention and will begin the race from their respective finishing positions based on their fastest completed lap time. The Q2 stage replicates this process but with only the 15 remaining drivers and a reduced time frame of 15 minutes. The top 10 drivers in Q2 progress to Q3, where they battle in a 12-minute shootout session. The fastest time earns pole position and will start the race on Sunday in first place with the other drivers following in cascading order (Rivera, 2023).
Sprint Race
Attempting to improve the entertainment value of race weekend and maximize viewership, Formula 1 proposed and trialed a sprint format in 2021 at three race weekends. Sprints were designed to create more racing action and a change in the grid ahead of Sunday with an extra, shortened race on Saturday. The format returned for both the 2022 and 2023 seasons (Coleman, 2023).
Traditional qualifying takes place on Friday, and a sprint shootout qualifying takes place on Saturday morning with a very similar process. After the shootout, the drivers compete in a one-third distance race with the top eight finishers earning points toward their championship standing. The Friday qualifying still determines the grid for the main Sunday race, with the sprint shootout and ensuing race occurring independently on Saturday (Coleman, 2023).
The sprint weekends included in this research were hosted at Silverstone in the United Kingdom (2021), the Italian Grand Prix (2021), the Sau Paul Grand Prix in Brazil (2021, 2022), at Emilia Romagna in Italy (2022), and the Austrian Grand Prix (2022) (Bianchi, 2023).
Scoring
Points are awarded to the top 10 drivers in Grands Prix with an additional point awarded to the driver with the fastest lap if he finishes within the top 10 (Booth, 2023). The scoring rules are as follows:
- No points will be awarded unless the minimum of two laps have been completed under green flag conditions.
- Points will be awarded on a 6-4-3-2-1 basis to the top five if less than 25 percent of the race is completed.
- Points will be awarded on a 13-10-8-6-5-4-3-2-1 basis to the top 10 if 50-75 percent of the race is completed.
- Points will be awarded on a 25-18-15-12-10-8-6-4-2-1 basis to the top 10 if more than 75 percent of the race is completed.
- Points will be awarded on an 8-7-6-5-4-3-2-1 basis to the top eight during a sprint race (Formula 1, 2023).
The points are added up over the course of the season and go toward the World Drivers’ Championship (WDC) and World Constructors’ Championship (WCC). Drivers compete individually for the former and combine their points with their teammates for the latter. The driver and team with the most points at the end of the season are crowned champions (Booth, 2023).
III. Methods
Studying the effects of outcome uncertainty on Formula 1 audience viewership is not a new endeavor. Researchers have used several variables to define outcome uncertainty, including running point totals, betting odds, and qualifying times (Krauskopf et al., 2010; Butler et al., 2023; Screyer & Torgler, 2018). Viewership fluctuations have similarly been studied through technological advancements, globalization, and overall sporting spectacle (Wood and Burkhalter, 2023; Capparelli, 2016; Schneiders & Rocha, 2022). However, these studies are either localized to countries with prominent Formula 1 followings – such as the United Kingdom, Germany, and Italy – or have skewed in relevance as the years continue to pass since their completion.
This research aims to answer the following: How does outcome uncertainty, as defined by race-specific qualifying times and final driver and constructor point totals, impact global Formula 1 viewership?
To understand the proposed question, 82 Grands Prix were analyzed, spanning from the beginning of the 2019 season to the end of the 2022 season. The 2020 season was impacted by Covid-19 with Grands Prix in the United States, Brazil, Canada, Mexico, Australia Azerbaijan, Singapore, Japan, China, and Vietnam all canceled due to rising infections and travel restrictions (Barretto, 2020). However, the estimations that follow are not affected by a possible substitution of fans who normally attend those races in-person watching on their televisions as no race was hosted at all.
Global viewership data for each independent race was manually collected from yearly press releases on the official Formula 1 website. Global viewership data was used to provide an overview of trends in the entire landscape of the sport and offers an opportunity for future study on independent markets. These numbers were inserted into the same spreadsheet in the row with their corresponding race and year.
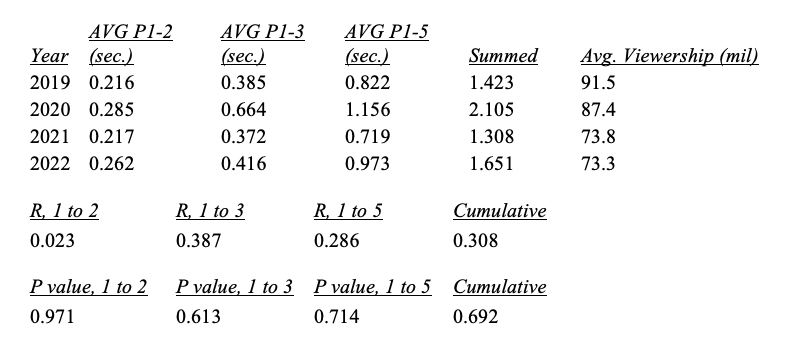
Qualifying times for the top five drivers at the selected races were manually collected from the archives hosted on Formula 1’s official website. These results were inserted into an Excel spreadsheet with other column headers including year, race, driver, and car. A formula was used to calculate the difference between the qualifying times of the 1st and 2nd fastest drivers, and two more columns were created for the difference between 1st and 3rd and 1st and 5th. An independent table was then made comparing the average difference in qualification time, the standard deviation, and the correlation coefficient of the averages to the viewership metric of each season. These results were then used to determine the level of significance between the proximity of the drivers’ qualifying times and audience viewership during each season.
To understand the impact of total driver points on viewership, a new table was made for the 2019 season with the champion driver’s name in the first column, each race of the season in the second, and the total points won per race in the third. A separate table was created that listed top-five finishing drivers by points at the end of the season with their name, their team, and their total points listed in columns. This was repeated for the other three seasons.
Another table was then made comparing the average final point difference between 1st and 2nd, 1st and 3rd, and 1st and 5th for each season, the standard deviation of each, and the correlation coefficient of the averages to the viewership metric of each season. These results were then used to determine the level of significance between the proximity of the top drivers’ final points in each season and audience viewership.
The exact process was repeated for constructor point totals with the exclusion of any driver-specific data. Final total points summed the final total points of both the team’s drivers.
IV. Findings
This study examined the relationship between three key performance indicators – qualification times, final driver points, and final constructor points – and their influence on season-average Formula 1 global viewership across the 2019-2022 seasons.
While not enough data points are readily available for a statistically significant study due to a lack of viewership data availability on a race-by-race basis, summary statistics provide an overview that can be used to assess trends and patterns. A revisitation to this study with either race-specific viewership numbers or more years of data will yield more valid results.
Qualification Times
Qualification times displayed fluctuating patterns over the four years. The 2019 season saw the second least amount of variance between the number two, three, and five qualifying times in relation to the time set by the pole driver. The time between pole and P2 (0.216 sec) was the smallest, while pole and P3 (0.385) and P5 (0.822) were both the second smallest among the four seasons studied. Low standard deviations across all three measures (0.205, 0.244, 0.330) suggest that the gaps in qualification times were consistent, with little variation among races. The season also had the largest average viewership with 91.5 million per Grand Prix.
The shortened 2020 season was the most volatile of the four in terms of qualification variance. The measured times (0.285, 0.664, 1.156) were all the largest among the studied seasons. Expectedly, all standard deviations increased compared to the 2019 season, reaching 0.306, 0.416, and 0.767. These results reflect a more significant level of variability in qualification times, especially between P1 and P5, which is explained by a heighted p value. Such results indicate greater diversity in performance among the races that year, which is significant when considering that average Formula 1 viewership dropped 4.5% to 87.4 million per Grand Prix.
The 2021 season was the most competitive in terms of qualification variance. The time between pole and P2 (0.217 sec) was the second smallest, while both pole and P3 (0.372) and P5 (0.719) were the smallest of the four seasons studied. The standard deviations for P1-P2 and P1-P3 (0.190, 0.241) dropped below 2019 levels but increased in P1-P5 (0.420) showing inconsistencies in those times. Average viewership dropped 19.3% from the 91.5 million per Grand Prix in 2019 to 73.8 million.
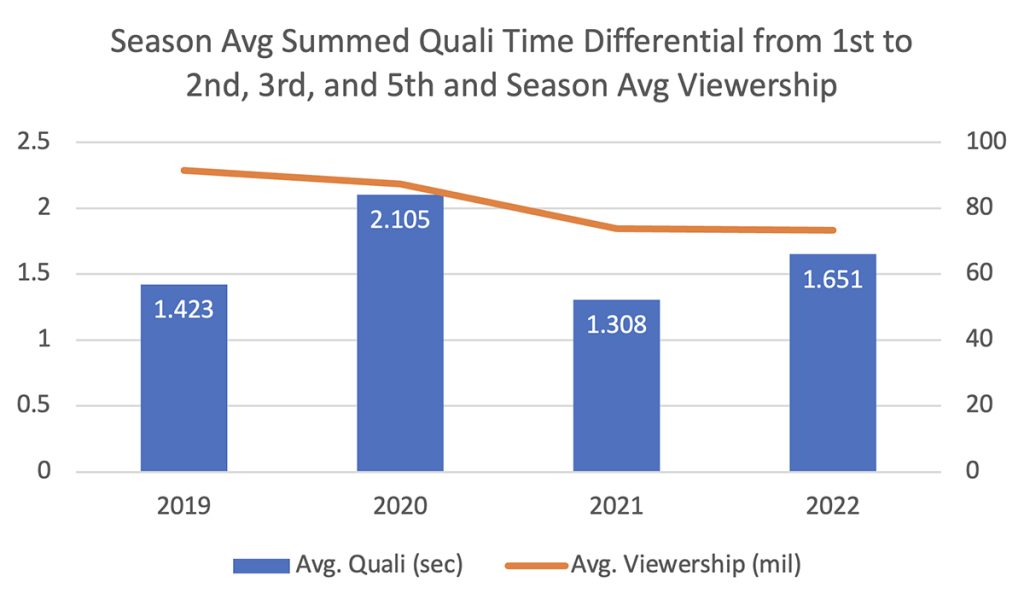
Figure 1: Season average qualifying times of pole to second, pole to third, and pole to fifth were summed to determine how competitive the top five drivers were each season. The lower the number, the more competitive the qualifying sessions from a season-long perspective. The orange bar represents the average viewership per race each season.
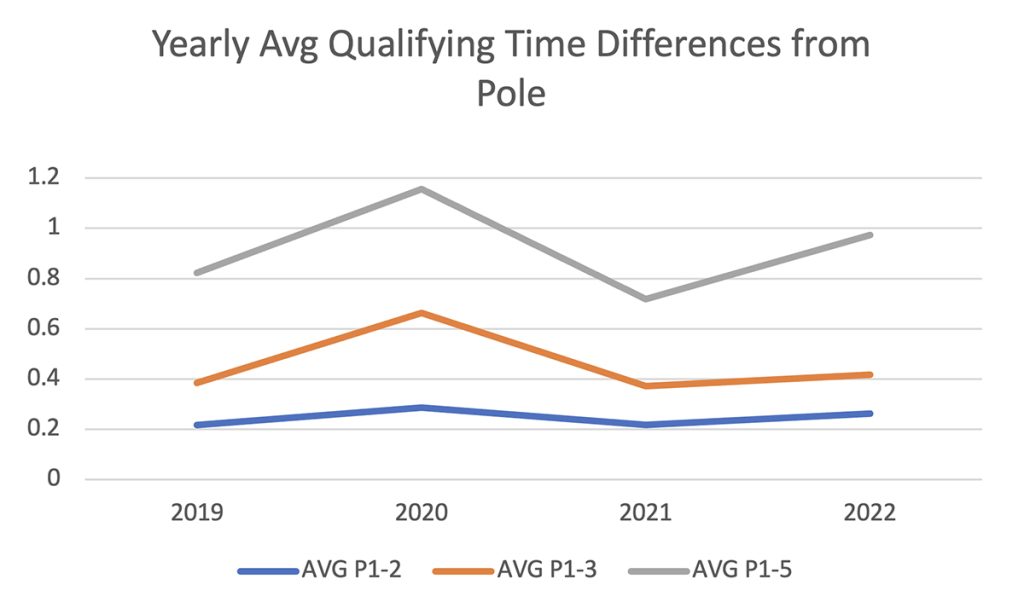
Figure 2: Average qualifying time gaps between pole to second, pole to third, and pole to fifth compared individually across seasons.
The 2022 season ranked third in terms of qualification variance. The average times measured (0.262, 0.416, 0.973) all ranked third. Standard deviations remained relatively high (0.317, 0.373, and 0.467) suggesting that qualification times remained subject to significant fluctuations. Viewership dropped 19.9% from the 2019 season’s 91.5 million to 73.3.
The Pearson correlation coefficients (CORREL) were calculated to assess the relationship between the performance metrics and season-average viewership. P1-P2 showed a very weak positive correlation (r=0.023) that can largely be considered negligible. P1-P3 showed a small positive correlation (r=0.387), and P1-P5 showed a weaker positive correlation (r=0.286).
World Drivers’ Championship (WDC) Points
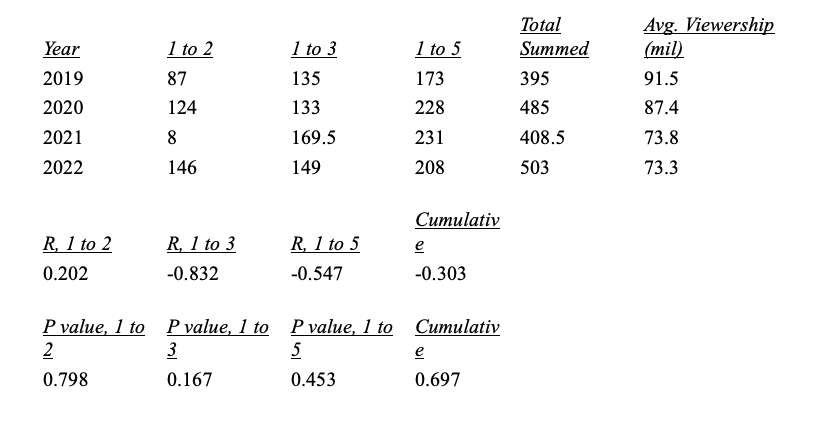
Driver points demonstrated distinct trends. In 2019, the separation between the champion and second place was 87 points, first to third was 135, and first to fifth was 173. These scores remained relatively consistent throughout the other observed seasons with standard deviations of 60.605, 16.829, and 26.696 for the same measures. These results signify important fluctuations among the top two drivers, relatively consistent point distributions between first and third, and somewhat unpredictable levels between first and fifth.
From a points standpoint, the 2019 season was the most competitive, with the top five drivers separated by 173 points, and garnered the highest viewership (91.5 mil). The next closest seasons were 2021 (408.5 points, 73.8 mil), 2020 (485, 87.4 mil), and 2022 (503, 73.3 mil). It’s notable that the most and least competitive years each received the highest and lowest viewership numbers.
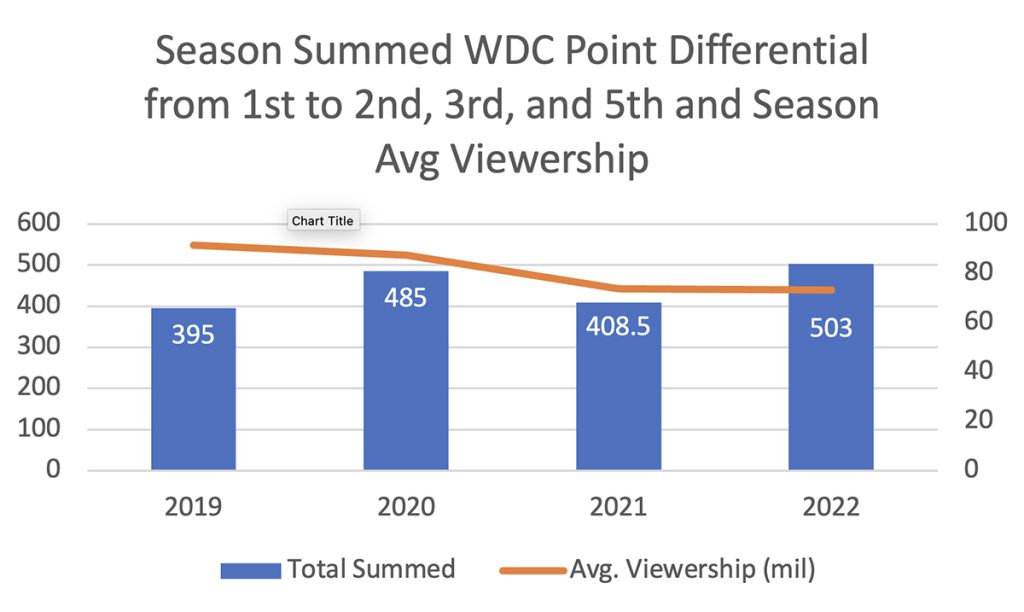
Figure 3: Season drivers’ point differentials of first to second, first to third, and first to fifth were summed to determine how competitive the top five drivers were each season. The lower the number, the more competitive the top drivers were from a season-long perspective. The orange bar represents the average viewership per race each season.
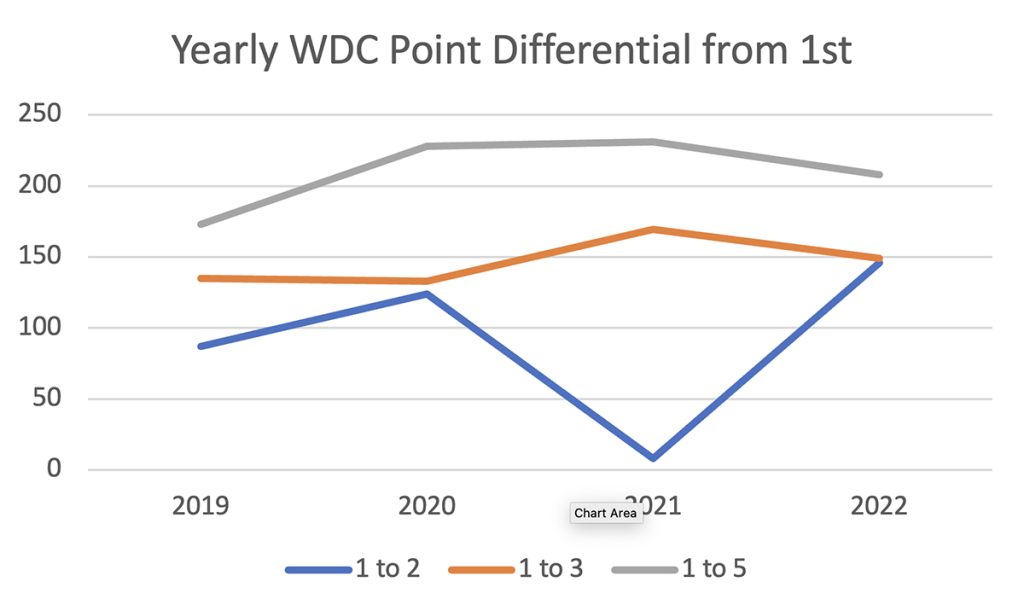
Figure 4: Average end-of-season driver point differentials between first to second, first to third, and first to fifth compared individually across seasons.
The correlation coefficients (CORREL) were calculated to assess the relationship between the performance metrics and season-average viewership. 1-2 observed a weak, positive relationship (r=0.202). 1-3 observed a strong, negative relationship (r= -0.832) which suggests that as the gap between first and third grows, viewership drops off. 1-5 showed a moderate, negative relationship (r= -0.547), which can suggest the same as the previous, to a lesser degree.
World Constructors’ Championship (WCC) Points
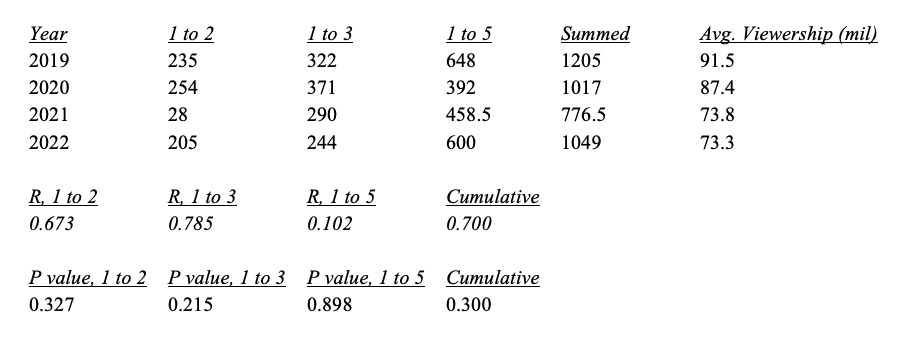
In 2019, the separation between the champion and second place was 235 points, first to third was 322, and first to fifth was 648. These scores turned highly volatile throughout the other observed seasons with standard deviations of 103.648, 53.475, and 119.533 for the same measures. These results signify significant fluctuations among the top two teams, high inconsistencies between first and third, and massive unpredictability between first and fifth.
Trends from constructor points are nearly impossible to identify. The 2021 season was the most competitive, with the top five teams separated by 776.5 points, but ultimately had the second lowest viewership (73.8 mil). 2020 was the second most competitive (1017 points, 87.4 mil), with 2022 third (1,049, 73.3) and 2019 fourth (1205, 91.5 mil). It’s notable that the least competitive year received the most viewership, while the most competitive received considerably less.
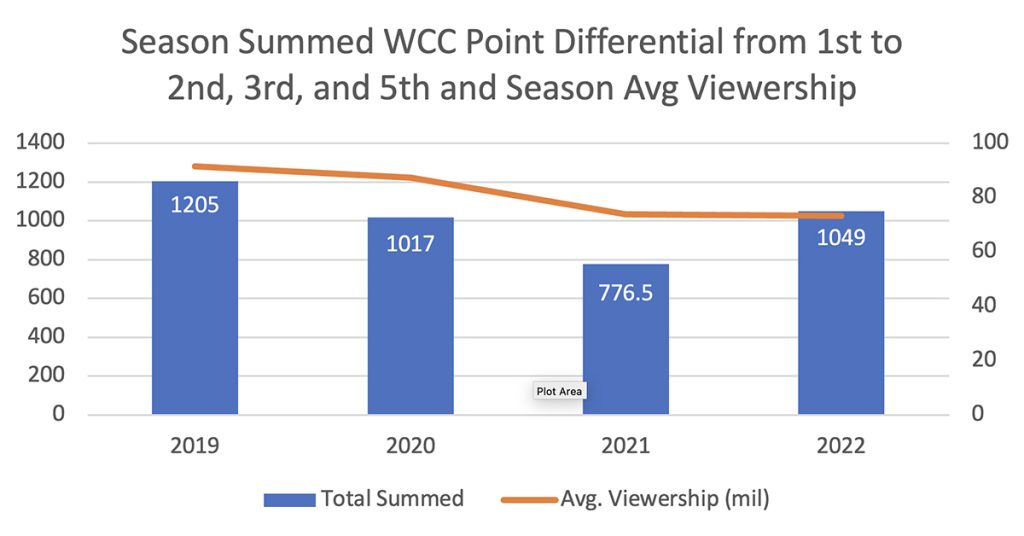
Figure 5: Season constructors’ point differentials of first to second, first to third, and first to fifth were summed to determine how competitive the top five constructors were each season. The lower the number, the more competitive the top constructors were from a season-long perspective. The orange bar represents the average viewership per race each season.
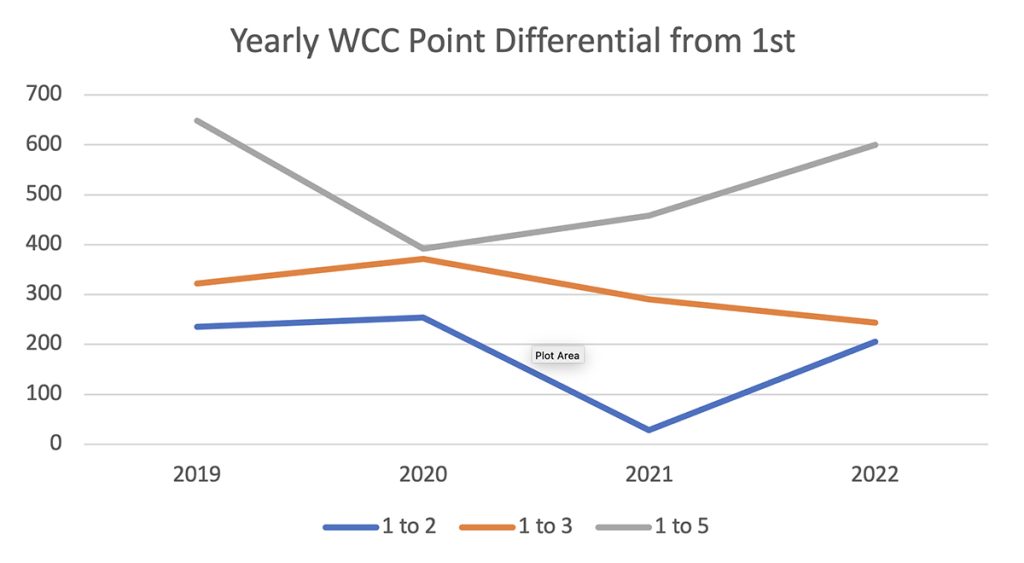
Figure 6: Average end-of-season constructor point differentials between first to second, first to third, and first to fifth compared individually across seasons.
Using the correlation coefficient (CORREL), 1-2 observed a relatively strong, positive relationship (r=0.673) to viewership. 1-3 shows a strong, positive relationship (r=0.785), and 1-5 shows a weak, positive relationship (r=0.102).
V. Discussion
Formula 1 is known for its dynamic and unpredictable nature. The sport is influenced by multiple variables, including track conditions, heritage races, weather, technical advancements, and driver skills. The fluctuations in qualification times reflect such factors, and while they may have an impact on viewership metrics, the overall weak correlation suggests that other factors play more significant roles.
It’s important to recognize that the intricate strategies and competition dynamics of Formula 1 races can create situations where close qualifying times do not necessarily translate into exciting races. Conversely, larger gaps in qualification times can sometimes lead to dramatic and unpredictable races where viewership surges. Trends suggest that viewership is not determined by the closeness of qualification times but by other elements that could include strategy, overtaking opportunities, and the overall quality of the race, which this study does not consider.
Analysis of the 2021 season is incredibly interesting in this study when considering its remarkable drop in viewership. The highly contested season between Red Bull and Mercedes culminated in one of the most exciting finales in the sport’s history, where Max Verstappen stole a championship from Lewis Hamilton on the last lap of the season. The correlation shows that close competition among the top three and five drivers, as indicated by a smaller point difference, tends to be associated with higher viewership. However, the 2021 season viewership dropped 19.3% from its 2019 numbers. The data suggests that because only two drivers were competing for the championship, fans of other drivers may have been alienated and disengaged with the season.
Additionally, correlations in the constructor data suggest that as the points between the teams increase, so does viewership. This indicates that viewers are more inclined to engage with Formula 1 when there’s a clear distinction in performance between the top constructors. Dominance and predictability in the competition among the top teams appeal to certain segments of viewers, particularly noted in Mercedes’ dominant run during the 2019 and 2020 seasons, which garnered the highest viewership numbers. Fans engage more during seasons where a single team is dominant or where there is overall less competition and unpredictability among the constructors.
Interestingly, however, when considering the gap between the top five constructors, the relationship weakens. This suggests that competitive balance outside of the top three teams may be more important to viewers than within the top group. Audiences then may favor seasons with a dominant team but a highly contested mid-pack. Ultimately, such results imply that fans, to some extent, likely prefer driver over constructor competition in Formula 1.
Traditionally, rule changes in Formula 1 have been initiated by sports administrators in response to dominant teams and drivers. Notably, the Federation Internationale de l’Automobile (FIA), Formula 1’s governing body, adopted significant cost-cutting measures to help smaller teams remain competitive. The regulations expanded at the start of the 2013 season, and, in 2021, a budget cap of $140 million per season was put into place. While these rule changes are typically driven by legitimate sporting concerns, the research findings here suggest that, in the short to medium term, a decline in outcome uncertainty has little impact on viewership. This is true when assessed using qualification times and season driver and constructor point totals. Therefore, the present dominance of Red Bull and Max Verstappen should not be of major concern to race organizers, though this kind of research needs constant attention as the data fluctuates each season.
While the results of the study are mixed, fans don’t appear to display a preference for a more competitive qualifying or overall season. This aligns with the findings of Gooding and Stephenson (2017), Kang et al. (2019), and Butler et al. (2023). However, the results differ from Dang et al. (2015) and Mizak et al. (2007), who both reported a fan preference for greater outcome uncertainty.
Ultimately, there simply isn’t enough data to draw any definite conclusions from this study. Since Formula 1 changed what it constitutes as a “viewer” after the 2018 season, any historical data from before then is largely useless. As more races are completed with this definition, clearer results will be drawn. Further research would also benefit from exploring mobile streaming data and social media trends for Formula 1, its teams, and their drivers. These forms of engagement continue to rise in popularity with easier accessibility to abbreviated highlights after the event is completed, which may help explain the recent drop in television viewership.
VI. Limitations
While this study offers valuable insights into the relationship between performance metrics and viewership in Formula 1, it is important to acknowledge several limitations that should be considered when interpreting the results.
Primarily, a small sample size was used due to the lack of available data. Since Formula 1 changed what it constitutes as a “viewer” after the 2018 season, any historical viewership data from before then is largely incomparable to the races after. Formula 1 also withholds most race-specific data and only releases full season viewership totals. Consequently, this study only analyzes averaged data from the 2019-2022 seasons. A larger, specified data set covering a broader time frame would provide a more comprehensive understanding of viewership trends.
Further, due to time constraints placed on the study, simplified metrics were used to gauge the competitiveness of the sport. Qualification times and cumulative points cannot encompass the complexity of Formula 1, which involves various dynamic factors such as race strategy, regulations, and numerous external factors. The correlation analysis presented in this study also cannot identify absolute causation between performance metrics and viewership and should be reassessed with the emergence of additional data.
The study was also impacted by the Covid-19 pandemic despite using average viewership to try and offset its impact. The Monaco, Dutch, Azerbaijan, Singapore, Japanese, Canadian, Mexico, United States, Brazil, and Chinese Grands Prix were cancelled in 2020 while several others ran without live audiences. Consequently, viewers who typically watch in-person may have been forced to watch the races on television, while other viewers might have boycotted the season if their home Grand Prix was cancelled.
The study also relies on purely quantitative data, which limits its contextual scope. The use of qualitative data through interviews with fans and stakeholders could provide additional depth of analysis into the various preferences of Formula 1 viewers. Such research could help further the research on subjective viewer preferences.
Further, as mentioned in the literature review, this study does not account for audience engagement from social media, mobile streaming, post-race highlights and recaps, or the influence of television series like Netflix’s Drive to Survive. The improved accessibility to condensed races may have become more appealing to audiences than watching the entirety of a two-hour event, especially if the start time of the race is inconvenient. The impact of mobile viewership needs to be explored further.
These limitations underscore the need for a cautious interpretation of the findings and highlight areas for future research. Formula 1 is a highly dynamic sport influenced by a wide variety of variables. Further investigations should consider these complexities to provide a better understanding of the sport’s viewership trends and the role of performance metrics.
VII. Conclusion
Performance metrics have massive implications for the stakeholders of Formula 1. Billions of dollars change hands over the course of a season that takes the league to 20 different countries and in front of thousands of live fans. As with any entertainment industry, Formula 1 relies on viewership to succeed, so a keen understanding of dynamic fan preferences has paramount importance to the continued success of the sport.
For broadcasters, the research underscores the importance of contextualizing the presentation of Formula 1 races. Recognizing the correlation between certain performance metrics and viewership, broadcasters can tailor their coverage to emphasize pivotal moments, such as close competition between top drivers or the battle between midfield teams, that are likely to engage and retain a larger audience. Understanding the viewer’s connection with driver and constructor success can further guide broadcasters in crafting compelling narratives that resonate with fans.
League and team marketers, similarly, can gain an understanding of the performance metrics that resonate with their base audience. They can capitalize on these findings and tailor their campaigns for maximum impact, driving brand awareness and consumer engagement. Realigning their strategies to focus on a dominant constructor, such as Red Bull, can boost the potential for increased return on investment.
Team management and sponsors can also acquire a clearer method to success. The implications of the study can help them recognize that sustained excellence on the track bolsters team and driver reputations, which ultimately attracts sponsorship opportunities. A further virtuous cycle can emerge where teams, sponsors, and fans benefit mutually.
As the sport continues to evolve, the insights garnered from this study can inform decisions that enhance its global appeal, ensuring it remains a captivating spectacle for fans around the world. Ultimately, this research reinforces the idea that the performance on the racetrack is inextricably linked to the sport’s success as a global phenomenon, highlighting the mutual benefit that all stakeholders can derive from this correlation.
Acknowledgements
Thank you to my faculty mentor, Dr. Jessalynn Strauss, for her patience, guidance, and support through the entire research process. This paper is only possible through the advice and care offered by her.
References
Baecker, N., Ansari, P., & Schreyer, D. (2022). Formula 1 Grands Prix demand across different distribution channels. Managing Sport and Leisure, 1–14. https://doi.org/10.1080/23750472.2022.2115395
Barretto, L. (2020). Ross Brawn gives an update on the 2020 F1 calendar, racing at new tracks and using different layouts on old ones. Formula 1. Retrieved from https://www.formula1.com/en/latest/article.ross-brawn-gives-an-update-on-the-2020-f1-calendar-racing-at-new-tracks-and.6Omi7f7uVrsfNMgqR2jiP7.html
Bianchi, J. (2023). F1 is back: 2023’s new rules, rookies, key storylines, Hamilton’s bounce-back attempt and more. The Athletic. Retrieved from https://theathletic.com/4222318/2023/02/23/formula-1-rules-rookies-storylines-racing/
Booth, D. (2023). How does F1 points scoring system work? Points for Formula 1 races, sprints and fastest lap. Sporting News. Retrieved from https://www.sportingnews.com/us/formula-1/news/f1-points-scoring-system-explained-races-sprints-fastest-lap/tlvj8mqazsfwjq8vwom7mseb
Budzinski, O., & Müller-Kock, A. (2016). Market power and media revenue allocation in professional sports: The case of Formula One. Ilmenau Economics Discussion Papers, 20(102), 74-114. https://ssrn.com/abstract=2801836
Butler, R., Butler, D., & Fahy, R. (2023). Broadcasting demand for Formula One: Preferences for outcome certainty in the United States. Managing Sport and Leisure, 38(3), 253-272. https://doi.org/10.1080/23750472.2023.2235348
Capparelli, C. (2016). The World Formula One Championship and North America: The development of a globalized industrial sports complex? [Doctoral thesis, Birkbeck, University of London]. https://eprints.bbk.ac.uk/id/eprint/40212
Coleman, M. (2023). How F1 sprint races work – and how the new format will shake things up in Baku. The Athletic. Retrieved from https://theathletic.com/4460164/2023/04/28/how-formula-one-sprint-races-work/
Dang, T. M., Booth, R., Brooks, R., & Schnytzer, A. (2015). Do TV viewers value uncertainty of outcome? Evidence from the Australian Football League. Economic Record, 91(295), 523–535. https://doi.org/10.1111/1475-4932.12206
Evans, C. (2013). The media representation of Formula One as ‘spectacle’: Constructing sport as live mediatised event. [PhD Thesis, Cardiff University]. https://orca.cardiff.ac.uk/id/eprint/44837
Garcia-del-Barrio, P., & Reade, J. (2021). Does certainty on the winner diminish the interest in sports competitions? The case of Formula One. Empirical Economics, 63(2), 1059-1079. https://doi.org/10.1007/s00181-021-02147-8
Gooding, C., & Stephenson, E. F. (2017). Superstars, uncertainty of outcome, and PGA tour television ratings. Journal of Sports Economics, 18(8), 867–875. https://doi.org/10.1177/1527002516637649
Goswami, S. (2023). Technology leadership lessons from Formula 1’s growth in North America. Forbes. Retrieved from https://www.forbes.com/sites/forbestechcouncil/2023/10/03/technology-leadership-lessons-from-formula-1s-growth-in-north-america/?sh=3ec43a4e8a78
Kang, B., Salaga, S., Tainsky, S., & Juravich, M. (2018). NCAA college basketball television viewership: Does preference for outcome uncertainty change throughout the season? International Journal of Sport Finance, 13(4), 373–391.
Kipker, I. (2003). Determinanten der kurzfristigen TV-Nachfrage in der Formel 1–Superstar-vs. Spannungseffekte und Implikationen für die Wettbewerbspolitik. Globalisierung des Wirtschaftlichen Wettbewerbes im Sport, 85–104.
Krauskopf, T., Langen, M., & Bünger, B. (2010). The search for optimal competitive balance in Formula One (No. 38). CAWM Diskussion Papier/Centrum für Angewandte Wirtschaftsforschung Münster.
Mizak, D., Neral, J., & Stair, A. (2007). The adjusted churn: An index of competitive balance for sports leagues based on changes in team standings over time. Economics Bulletin, 26(3), 1–7.
Neale, W. C. (1964). The peculiar economics of professional sports: A contribution to the theory of the firm in sporting competition and in market competition. The Quarterly Journal of Economics, 78(1), 1–14. https://doi.org/10.2307/1880543
Rivera, J. (2023). How does F1 qualifying work? Explaining the rules, format to determine F1’s starting grid. Sporting News. Retrieved from https://www.sportingnews.com/us/formula-1/news/formula-1-qualifying-rules-format-f1-starting-grid/wf6jwealizmukvt8zrsw3bw4
Rottenberg, S. (1956). The baseball players’ labor market. Journal of Political Economy, 64(3), 242–258. https://doi.org/10.1086/257790
Schneiders, C., & Rocha, C. (2022). Technology innovations and consumption of Formula 1 as a TV sport product. Sport Marketing Quarterly, 31, 186-197. https://www.storre.stir.ac.uk/retrieve/b44a215d-b320-461f-a2bf-fc6c90251cbe/2022_Schneiders.Rocha_F1%20technology.pdf
Schreyer, D., & Torgler, B. (2018). On the role of race outcome uncertainty in the TV demand for Formula 1 Grands Prix. Journal of Sports Economics, 19(2), 211-229. https://doi.org/10.1177/1527002515626223
Sylt, C. (2020). F1’s worldwide TV audience crashes by 20 million viewers. Forbes. Retrieved from https://www.forbes.com/sites/csylt/2020/01/21/f1s-worldwide-tv-audience-crashes-by-20-million-viewers/?sh=78165fc75a66
Van Reeth, D. (2023). The complexities of understanding reported TV audiences for live sports broadcasts. International Journal of Sport Finance, 18(1), 19-34. https://doi.org/10.32731/IJSF/181.022023.02
Wood, A., & Burkhalter, J. (2023). Fans, fame, f(ph)ilanthropy, and fury: The impact of Netflix’s “Drive to Survive” on F1 racing. In Sage Business Cases. SAGE Publications, Ltd. https://doi.org/10.4135/9781071914274